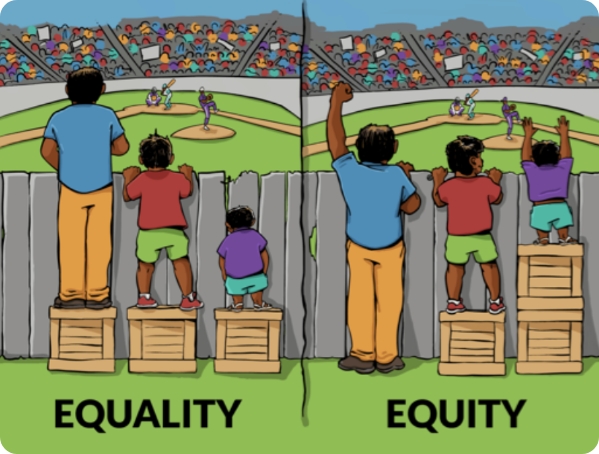
Equity and Equality
This image has become commonly used in illustrating the difference between equity and equality. The basic message is that equality is providing the same solutions to overcoming obstacles without full consideration of an individual’s (or group’s) unique circumstances. In order to provide equitable solutions, each individual (or group) must be provided the necessary means based on their unique set of circumstances.
This article published by the Milken Institute School of Public Health at George Washington University provides a deeper look at this topic. What’s the difference between Equity and Equality?
As we consider our community, let’s consider what equity looks like. And, if we see the opportunity, perhaps we can take it a step further and tear the fences down.
We must understand the difference between equality and equity if we are to solve root problems. When we provide individuals (and groups) the access and resources they need according to their own, unique set of circumstances (Equity), we’re providing them with the greatest opportunity to succeed.
Data Equity
by Liz Tharp, Impact & Learning Officer
Data is everywhere. Communities and organizations use data to highlight needs, to design programs and services, to learn and measure change. If equity is not considered, data can help promote the very injustices, biases and inequitable conditions that communities work hard to improve.
Understanding what ‘data’ is and the risks associated helps us better steward data resources to promote equity in communities.
Data takes many forms beyond numbers. The Equitable Evaluation Initiative (EEI) is a national movement that influences funders to balance their desire to use numbers with an understanding of context and the nuances of culture. EEI realizes that numbers alone do not tell the whole story. Beyond numeric data – pictures, videos and stories are types of data that are valuable and necessary to more clearly understand the people and conditions of our region.
Unless we’re intentionally thinking about ‘equity,’ data can reinforce the very conditions communities work to improve. Data from our last Health Survey highlights this point. We learned that 1 in 4 (24%) adults in Vanderburgh County have problems accessing fresh produce. Good data but focusing on this point alone would cause us to overlook an area of inequity. A closer look shows that half (48%) of all residents living in the 47713-zip code, have problems accessing fresh produce. Conversations with organizations and collaborations serving residents in this zip code back up the story this data is telling. If communities are not considering issues of equity with their data, they can risk designing solutions that leave out important geographies and populations.
| 24% of Vanderburgh County | 48% of 47713 zip code |
| Low access to fresh fruits and vegetables 2015 Tri-State Health Survey, WBF | |
Being good stewards of data means intentionally thinking about equity in all aspects of data usage. WBF incorporates equity thinking into each of the four large-scale, multi-county surveys we commission. Breaking down data by variables like race, ethnicity, zip code, income level, etc. is called ‘data disaggregation’ and this step helps us look for stories of inequity buried in the data. WBF has also built a relationship-based evaluation system that requires periodic in-person interactions with grantees. The EEI says that the best approaches to evaluation with grantees, “would be jointly designed by the foundation and the people it supports, and it would take into consideration the feelings, stories, and concerns of those people, not just an outcome that can be measured numerically.” Data collection plans for grantees in each grant cycle are made jointly, reports are given face-to-face and a variety of data forms are accepted as reports.
This matters because…
Just as we aim to steward dollars, time, knowledge and expertise for maximum impact, we need to use data responsibly and to ensure that the data we use tells an accurate story about ALL the populations and conditions represented. More equitable data helps support more equitable strategies and decisions.
Educational Equity
Continuing the conversation on Equity versus Equality, and looking ahead to the opening of our Early Learning Grant Cycle next month, we’re focusing this time on Educational Equity. The video above does a great job of explaining what Equity in Education is and shares some national statistics that support the increasing need for programs that provide equitable educational opportunity for everyone.
High-quality education matters. When we tend to the unique needs of each child and groups (i.e. Black, disabled, low income), nourishing their strengths and resourcing the areas where they may struggle, they’re more likely to not only succeed in their early education but to also be equipped with the tools they need to succeed in life.
Health Equity
The underlying message of the “Social Determinants of Health” is that the conditions in which people live have a more significant impact on their overall state of health than their genetics. Access to quality food, education, transportation, and living conditions all play a critical part in our health.
The concept of “Equity versus Equality” challenges the idea that giving “equal” treatment to every individual is adequate. Instead, equitable treatment accounts for individual/community needs and unique sets of circumstances.
This month, we’re taking what we’ve learned from each of the past two advocacy topics (the Social Determinants of Health and Equity versus Equality) as we look at Health Equity.
Understanding Health Equity is a vital piece in moving the needle in health outcomes. If we understand the relationship between “equity” and the Social determinants of Health (access to quality food, affordable housing, education, transportation, stable income, and stable relationships), we are more likely to create sustainable change.